We have shared many chart plug-ins based on jQuery and HTML5 before, but many are implemented based on third-party plug-ins. The Frappe Charts chart application that we are going to share today does not rely on third-party script libraries, but Frappe Charts still implements very practical chart applications, including line charts, pie charts, and column charts. The advantage of not relying on third-party libraries is that many functions that do not need to be used will not be included, thereby reducing the size of the application.
Advertisement
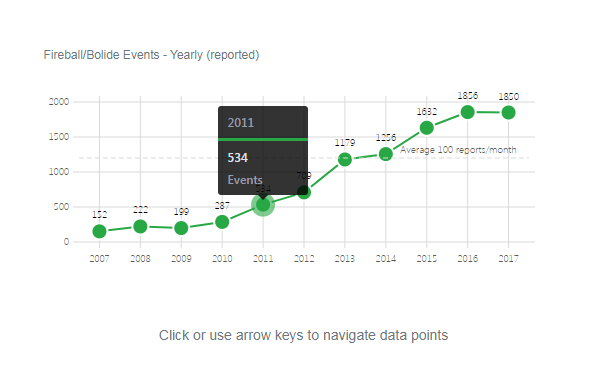
<div class="row hero" style="padding-top: 30px; padding-bottom: 0px;">
	<div class="jumbotron" style="background: transparent;">
	  <h1>Frappe Charts</h1>
	  <p class="mt-2">GitHub-inspired simple and modern charts for the web</p>
	  <p class="mt-2">with zero dependencies.</p>
	</div>

	<div class="col-sm-10 push-sm-1 later" style="font-size: 14px;">
	  <div id="chart-composite-1" class="border"><svg height=225></svg></div>
	  <p class="mt-1">Click or use arrow keys to navigate data points</p>
	</div>
	<div class="col-sm-10 push-sm-1 later" style="font-size: 14px;">
	  <div id="chart-composite-2" class="border"><svg height=225></svg></div>
	</div>
  </div>
.page-header {
	width: 100%;
	text-align: center;
	color: #fff;
	padding: 2em 0;
}
.jumbotron {
    padding: 2rem 2rem;
}
.project-name {
	padding-top: 1.8em;
	font-size: 2.5em;
}
.project-tagline {
	font-size: 1em;
	opacity: 0.7;
	padding: 2em;
}
.btn-transparent {
	margin: 0 0.5em;
	color: #fff;
	background: rgba(255, 255, 255, 0.1);
	border: 1px solid rgba(255, 255, 255, 0.4);
}
.btn-transparent:hover {
	color: #fff;
	background: rgba(255, 255, 255, 0.3);
}

.main-content {
	padding: 2em;
}

.main-content .row {
	margin-bottom: 20px;
}
let reportCountList = [152, 222, 199, 287, 534, 709,
	1179, 1256, 1632, 1856, 1850];

let lineCompositeData = {
	labels: ["2007", "2008", "2009", "2010", "2011", "2012",
		"2013", "2014", "2015", "2016", "2017"],

	yMarkers: [
		{
			label: "Average 100 reports/month",
			value: 1200,
		}
	],

	datasets: [{
		"name": "Events",
		"values": reportCountList
	}]
};


let fireball_5_25 = [
	[4, 0, 3, 1, 1, 2, 1, 1, 1, 0, 1, 1],
	[2, 3, 3, 2, 1, 3, 0, 1, 2, 7, 10, 4],
	[5, 6, 2, 4, 0, 1, 4, 3, 0, 2, 0, 1],
	[0, 2, 6, 2, 1, 1, 2, 3, 6, 3, 7, 8],
	[6, 8, 7, 7, 4, 5, 6, 5, 22, 12, 10, 11],
	[7, 10, 11, 7, 3, 2, 7, 7, 11, 15, 22, 20],
	[13, 16, 21, 18, 19, 17, 12, 17, 31, 28, 25, 29],
	[24, 14, 21, 14, 11, 15, 19, 21, 41, 22, 32, 18],
	[31, 20, 30, 22, 14, 17, 21, 35, 27, 50, 117, 24],
	[32, 24, 21, 27, 11, 27, 43, 37, 44, 40, 48, 32],
	[31, 38, 36, 26, 23, 23, 25, 29, 26, 47, 61, 50],
];
let fireball_2_5 = [
	[22, 6, 6, 9, 7, 8, 6, 14, 19, 10, 8, 20],
	[11, 13, 12, 8, 9, 11, 9, 13, 10, 22, 40, 24],
	[20, 13, 13, 19, 13, 10, 14, 13, 20, 18, 5, 9],
	[7, 13, 16, 19, 12, 11, 21, 27, 27, 24, 33, 33],
	[38, 25, 28, 22, 31, 21, 35, 42, 37, 32, 46, 53],
	[50, 33, 36, 34, 35, 28, 27, 52, 58, 59, 75, 69],
	[54, 67, 67, 45, 66, 51, 38, 64, 90, 113, 116, 87],
	[84, 52, 56, 51, 55, 46, 50, 87, 114, 83, 152, 93],
	[73, 58, 59, 63, 56, 51, 83, 140, 103, 115, 265, 89],
	[106, 95, 94, 71, 77, 75, 99, 136, 129, 154, 168, 156],
	[81, 102, 95, 72, 58, 91, 89, 122, 124, 135, 183, 171],
];
Advertisement